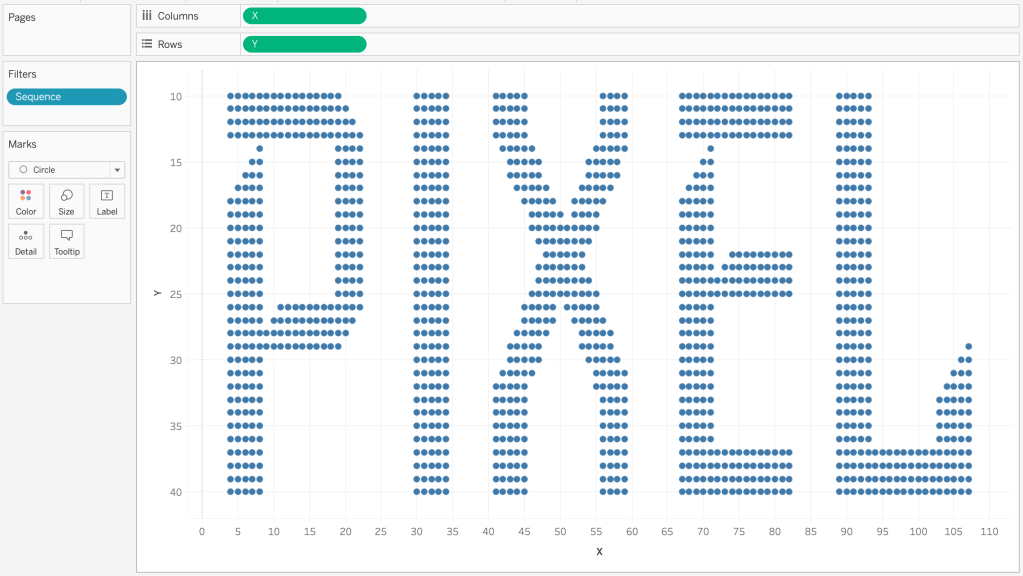
Inspired by Ken Flerlage’s amazing 3 posts It’s All About the X & Y, I had an idea to use X and Y points to create pixel letters. I wanted to use every pixel point to represent one day that I lived in a city and all the points together form the name of the city.
Below is what I end up building for the viz. In this post, I am going to write about creating the X & Y for the AUSTIN and any other words or characters you’d like to visualize.

Step 1 – Paste the following Python code into Jupiter Notebook.
Step 2 – Upload the font file (I used Iceberg-Regular.ttf) to the folder.
Step 3 – Run the code and download the output.csv file in the folder directory.
Step 4 – Connect the output.csv to your Tableau.
Step 5 – Enjoy creating your viz! 🙂
Tips for creating visuals in Tableau:
- Change X and Y as dimensions
- Edit y-axis -> General -> Scale -> Tick Reversed
- Filter out Sequence = -1 if you don’t need the negative space to be filled with circles