Recently I am following a Fullstack D3 course by Amelia Wattenberger, and I learned something useful to make yesterday’s scatter plot better. 🙂
Nice()
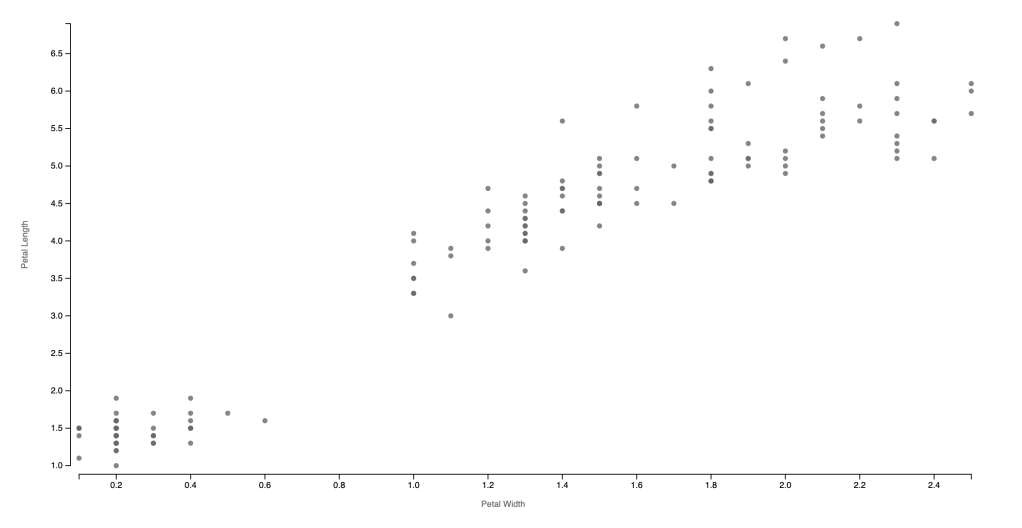
First, we can add a nice() function to our axis. This “nice” function will round the domain value on the axis. Let’s see before and after adding “nice()”.
const xAxis = chart.append("g")
                    .attr("transform", `translate(0,${svgHeight-margin.bottom})`)                   .call(d3.axisBottom().scale(xScale.nice()))
                    .call(g => g.append("text")
                    .attr("x", chartWidth/2)
                    .attr("y", margin.bottom-12)
                    .attr("fill", "#666")
                    .attr("text-anchor", "end")
                    .text("Patal Width"))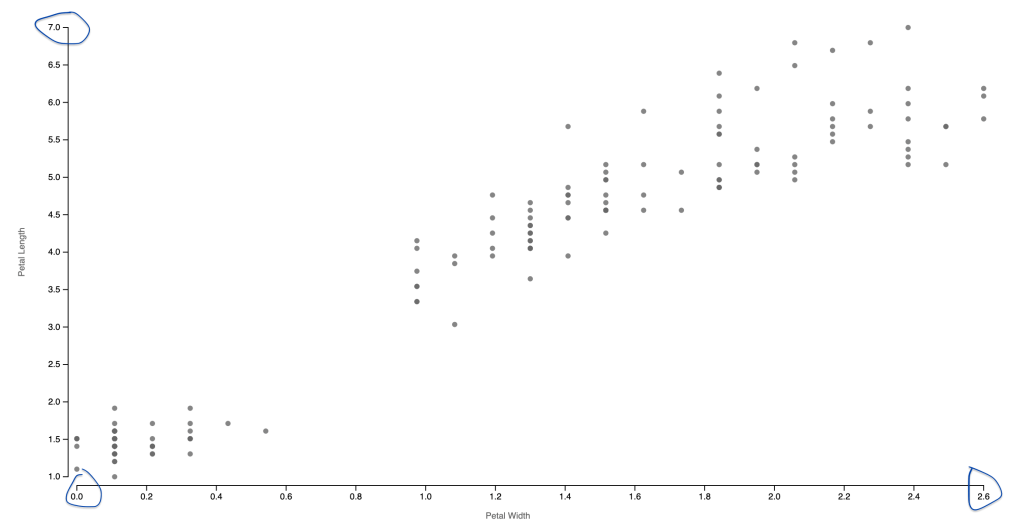
Refactoring the X and Y Value
Amelia uses “accessor functions” to access the X and Y value used for the charts. For the example we created yesterday, the x-axis is using the petal width while the y-axis is using the petal length. We actually repeated several times referring to the variable using d => d.PetalWidthCm and d => d.PetalHeightCm several times. We can create the following codes at the beginning to avoid repeating them.
const xAccessor = d => d.PetalWidthCm
const yAccessor = d => d.PetalLengthCm
The best benefit of doing this is no need to replace all the X and Y variables you referred to in the codes if later we decided to use other variables in the chart. Then we only need to change it once at the beginning, and we know to find it at the beginning of the code.
Color
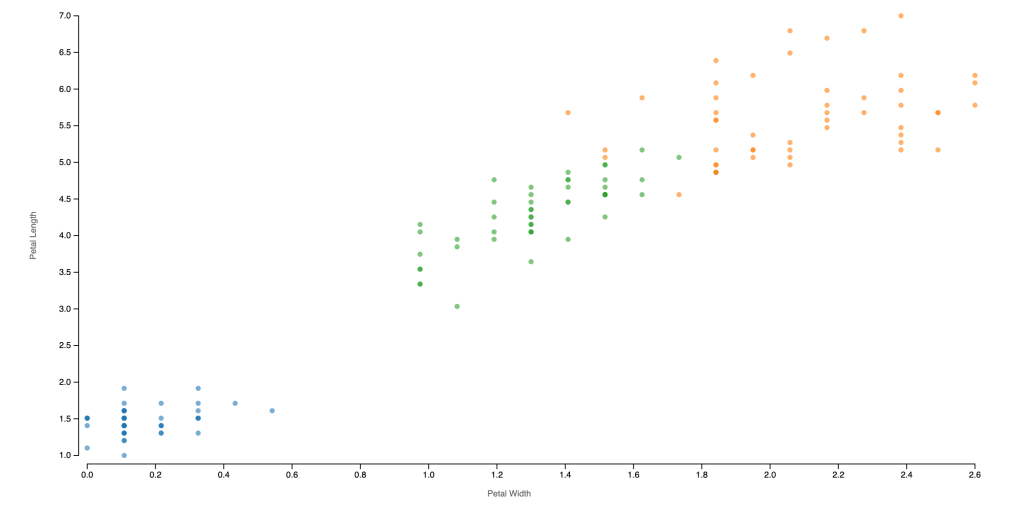
Let’s practice this accessor function by creating a colorAccessor to color our dots by their species. In order to add the color, we will also learn the ordinal scale function in D3. We used the “d3.scaleLinear( )” to create our X and Y scales. Color is an ordinal value, and so does species. I also added an opacity of 0.7 to the dots because there are overlapping dots. Using opacity can indicate how approximately how many dots are overlapping at the same position.
const colorAccessor = d => d.Species

const colorScale = d3.scaleOrdinal()
            .domain(d3.extent(dataset, colorAccessor))
            .range(d3.schemeCategory10)

const dots = chart.selectAll("circle")
        .data(dataset)
        .enter().append("circle")
        .attr("cx", d => xScale( xAccessor(d)))
        .attr("cy", d => yScale( yAccessor(d)))
        .attr("r", 3)
        .attr("fill-opacity",0.7)
        .attr("fill", d => colorScale( colorAccessor(d)))