Let’s add the tooltip to our scatter plot today.
On Day 5, we talked about the mouse event. To add a tooltip to the scatter plot, we will again use the mouse event. The idea is that we create the tooltip element and append it to our div, but we set the opacity to 0 at first so it is not showing the tooltip when we first load the chart. If we inspect the page, we can find the tooltip.
const tooltip = d3.select("#chart-area")
        .append("div")
        .style("opacity", 0)
        .attr("class", "tooltip")
        .style("background-color", "white")
        .style("border", "solid")
        .style("border-width", "1px")
        .style("border-radius", "5px")
        .style("padding", "10px")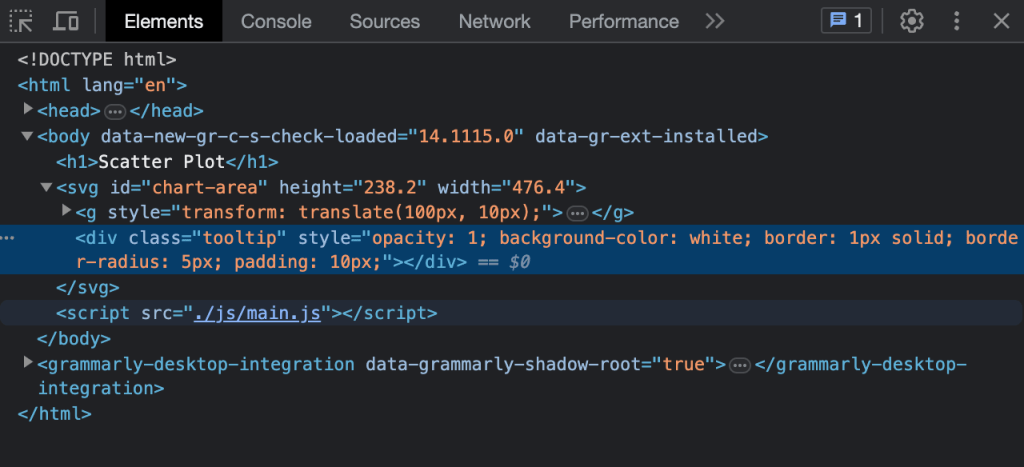
What we need to do next is to show the tooltip. We will do three things:
- Add text to the tooltip
- Translate the tooltip to the position near the dot
- Change the opacity to 1
Transition + Tooltip
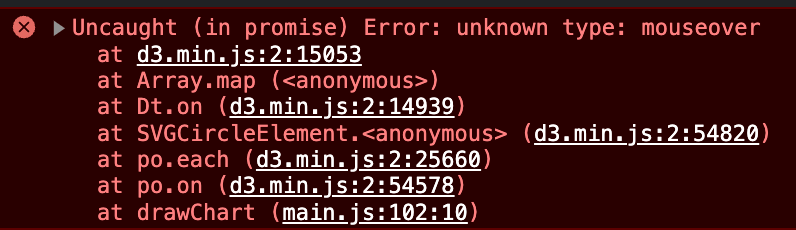
When I add a tooltip to the codes from yesterday, where I added a transition for animation. I got this error in the console. I realized that this is caused by the transition function. This post helped me to add transition and mouseover event separately. Instead of chaining the code together, we need to divide them into three blocks as below.
const dots = chart.selectAll("circle")
        .data(dataset)
        .enter().append("circle")
        .attr("cx", 0)
        .attr("cy", chartHeight)

    dots.transition().duration(2000)
        .ease(d3.easePolyOut.exponent(2))
        .attr("r", 3)
        .attr("fill-opacity",0.6)
        .attr("fill", d => colorScale( colorAccessor(d)))
        .attr("cx", d => xScale( xAccessor(d)))
        .attr("cy", d => yScale( yAccessor(d)))

    dots.on('mouseover', (event,d) => mouseOver(event,d))
        .on('mouseout', (event,d) => mouseOut(event,d))
        .on('mousemove', (event,d) => mouseMove(event,d))
Position the tooltip
I followed this example on the D3 gallery to add the tooltip. However, the position of my tooltip is off the chart. This is caused by the structure of my html file. I was appending a “div” element to the body, and SVG is a stand-alone element. I changed it to a tooltip div within a chart-area div.
 <body>
        <h1>Scatter Plot</h1>
        <svg id="chart-area" </svg>
        http://./js/main.js
    </body>
<body>
<h1>Scatter Plot</h1>
<div id="chart-area" class="chart-area">
<div id="tooltip" class="tooltip"></div>
</div>
http://./js/main.js
</body>However, a new problem arose. The position of my tooltip is not close to my dot. When I log the top and left pixels, it looks correct. Later, I spent quite some time to find out this document about the position. After some trial and error, I set the position of the chart-area div to “relative”, and the tooltip div to “absolute”. I also later added a left margin of the window.
.tooltip {
position: absolute;
text-align: center;
z-index: 10;
}
.chart-area {
position: relative;
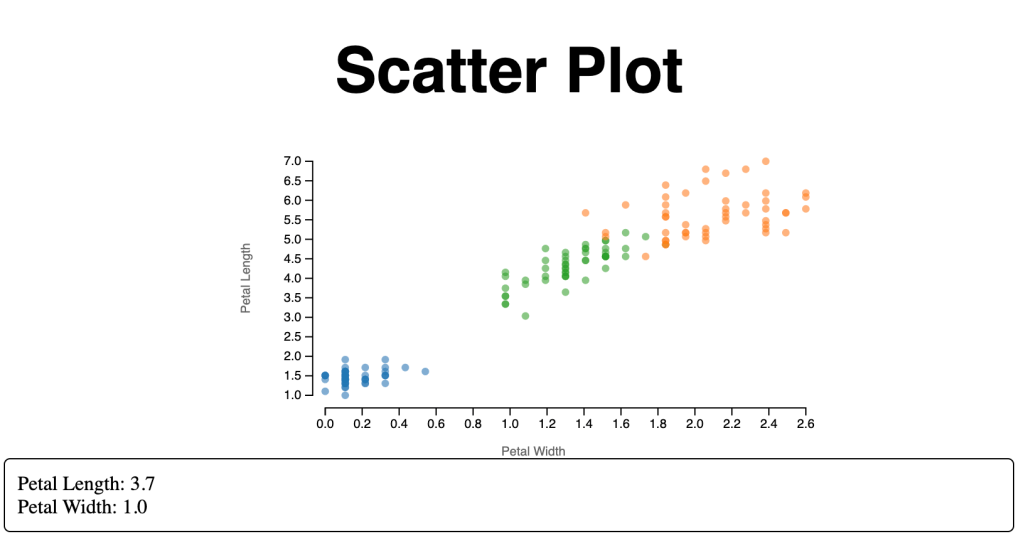
}function mouseMove(event,d) {
tooltip
.html("Petal Length: " + yAccessor(d)+
"<br>" + "Petal Width: " + xAccessor(d))
.style("left", xScale(xAccessor(d)) + margin.left + window.innerWidth * 0.2 + "px") "px")
.style("top", yScale(yAccessor(d)) + margin.top + "px")
}
One thought on “Day 10: Adding Tooltip”