Prepare the data
The first step for making a map is to have the geoJSON file. We can find the shapefile of Texas (FIPS code 48) here. Then we can use mapshaper.org to convert it to a geoJSON file.
Render the map
To create the map, we need to
- Define a projection
- Create a path element using this projection
- Append this path to our chart
const projection = d3.geoMercator()
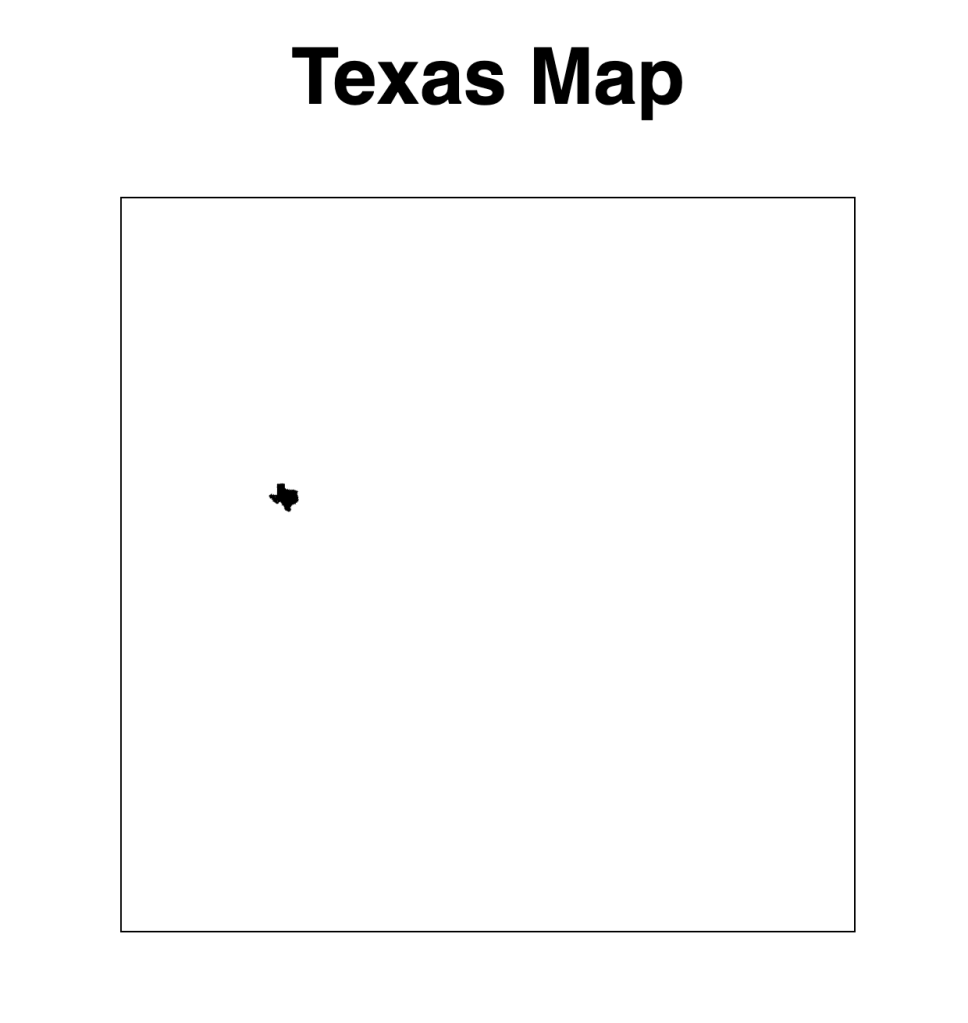
projection.fitSize([chartWidth,chartHeight],geojson)
const geojson = await d3.json("./data/texas.json")
chart.append("path")
.attr("d", path(geojson))
.attr("fill", "none") // This removes the fill color
.attr("stroke", "#666")The default fill of an SVG element is black, so we need to set the fill to “none”. Otherwise, it will be shown like this:
The .fitExtent and .fitSize didn’t work for me. The map will be very tiny. I don’t know the reason, but I found another solution to make it work.
projection
    //.fitExtent([[margin.top, margin.left], [svgWidth - margin.bottom, svgHeight - margin.right]], geojson)
    //.fitSize([chartWidth,chartHeight],geojson)
    //both of these methods do not work
    .scale(3500)
    .center([-99.9018, 33.9686])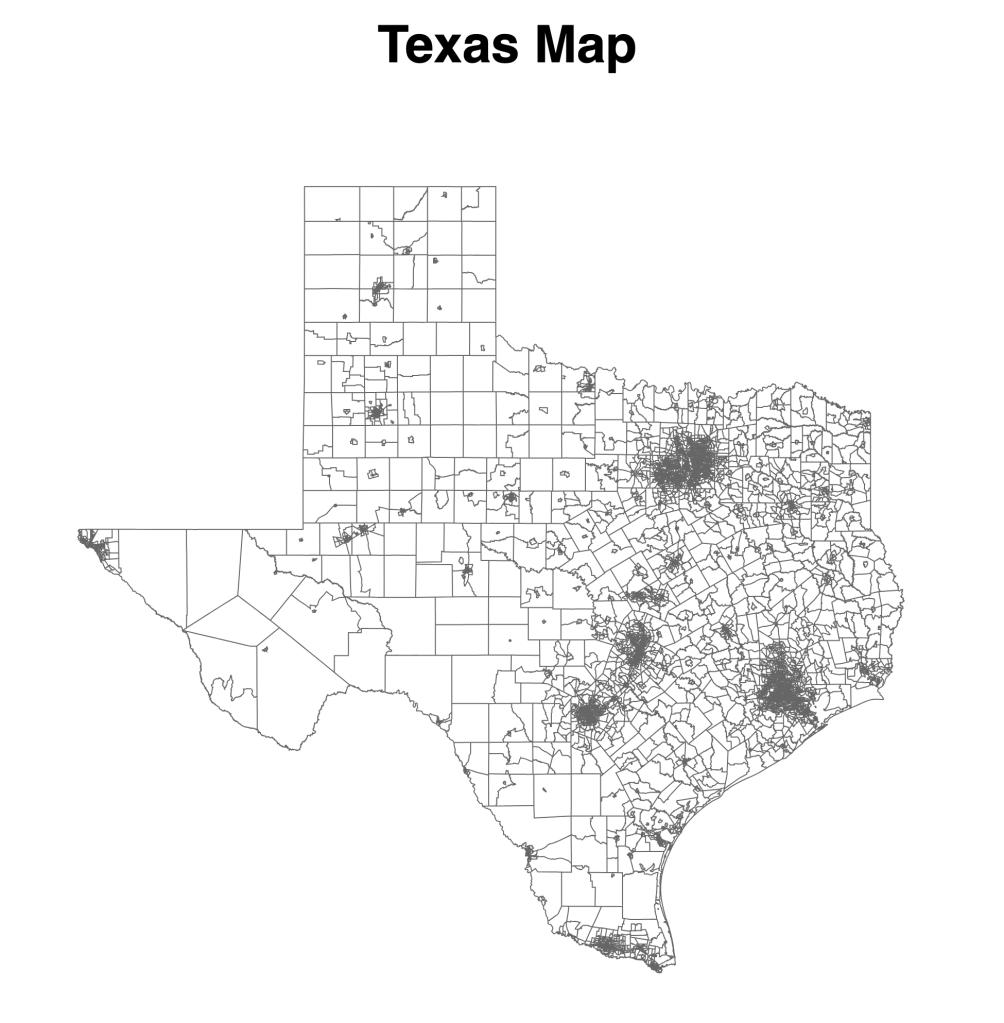
Today’s reference posts:
- Command-Line Cartography by Mike Bostock
- Drawing maps from geodata in D3 by Florian Ledermann
