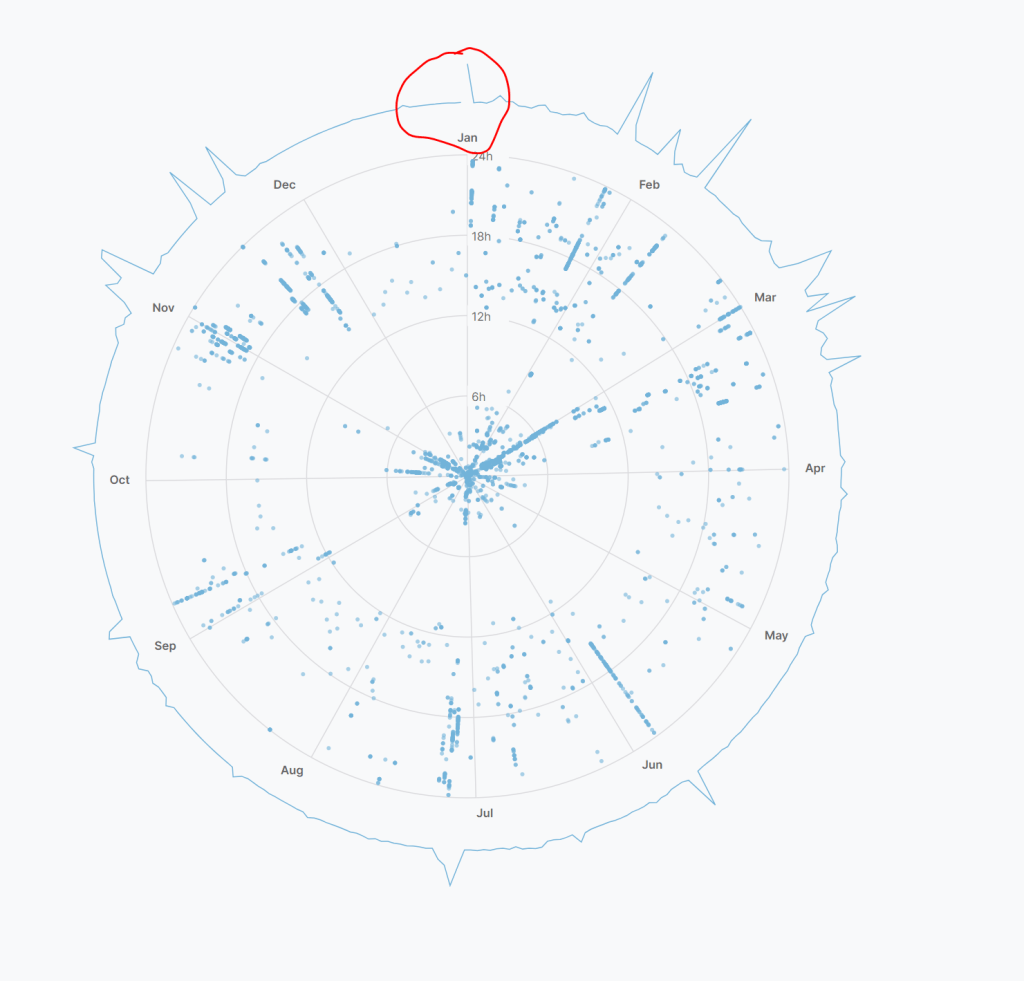
Here is the radar chart I created from the 5,061 photos I took in 2019. It’s interesting that I also found a font family called Dancing Script. 😛
It’s strange that I have so many photos taken from midnight to 6 AM. I figured out that I set the time of my camera wrong while traveling to different time zones. The photo taken with my photo has a more reliable time. But the date should be +/-1 day accuracy. 🙂

I learned this from Amelia’s course Radar Chart.
d3.timeMonth.range()
But what I struggled with today is setting up the date and time scale for the angleScale. At first, I don’t get January and December. The reasons are as follows from ChatGPT:
The starting date is January 1st, 2019, but the time is 18:43:22. The d3.timeMonth.range() function generates an array of the first date of each month within the specified range. However, since the starting date is not at the very beginning of January 1st (00:00:00), it considers that January has already “started” and hence skips to the next month when generating the range.
The d3.timeMonth.range() function gives a range of months between the start and end date. The start date is inclusive, while the end date is exclusive. That means if your roundedExtent’s end date is December 31st, the range will not include December, because the range is up to, but not including, that end date.
Close the line
I also want to close the line chart. To do this, I need to add the first data point to the end of my data.
    const loopedData = [...df, df[0]]

    bounds.append("path")
        .attr("fill", "none")
        .attr("stroke", "#72B2D9")
        .attr("d", lineGenerator(loopedData))