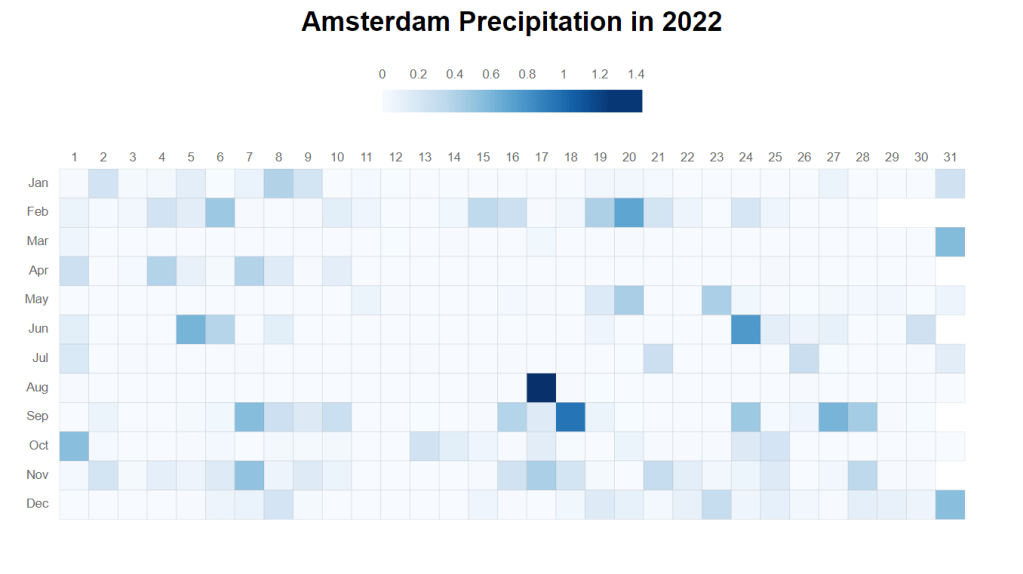
I was wondering how rainy 2022 was in Amsterdam. It was quite dry last year. I find a dataset here.
The idea to create a heat map is to position the rectangles. I want to arrange the days by month and day. Therefore, we will need to get the x and y according to the month and day of the date variable. Here is what I came up with.
const parseDate = d3.timeParse("%Y-%m-%d")
const dateAccessor = d => parseDate(d.datetime)

const monthFormat = d3.timeFormat("%m")
const yAccessor = d => +monthFormat(dateAccessor(d)) - 1
// -1 since months are 0-based

const dayOfMonthFormat = d3.timeFormat("%d")
const xAccessor = d => +dayOfMonthFormat(dateAccessor(d)) - 1
// -1 since days start from 1
After creating it, I noticed that the background is white, and it is hard to tell if there is no 31st day in a month or it has no rain in that rectangle. I set the stroke for the “rect” element and set a low opacity.


Adding legend
It would be nice to have a legend for the sequential scales.
Here is the code to add the legend to the heatmap.
    const defs = svg.append("defs");

    const gradient = defs.append("linearGradient")
        .attr("id", "precipitation-gradient")
        .attr("x1", "0%")
        .attr("y1", "100%")
        .attr("x2", "100%")
        .attr("y2", "100%")

    gradient.selectAll(".stop")
        .data(colorScale.ticks().map((t, i, n) => ({ offset: `${100*i/n.length}%`, color: colorScale(t) })))
        .enter().append("stop")
        .attr("offset", d => d.offset)
        .attr("stop-color", d => d.color)

    const legendWidth = 230
    const legendHeight = 20
    const marginLegend = 30

    svg.append("rect")
        .attr("x", svgWidth / 2 - legendWidth / 2)
        .attr("y", marginLegend)
        .attr("width", legendWidth)
        .attr("height", legendHeight)
        .style("fill", "url(#precipitation-gradient)")

    svg.selectAll(".legendText")
        .data(colorScale.ticks())
        .enter().append("text")
        .attr("class", "legendText")
        .attr("x", d => svgWidth / 2 - legendWidth / 2 + legendWidth * (d / d3.max(colorScale.domain())))
        .attr("y", marginLegend-10)
        .style("text-anchor", "middle")
        .text(d => d)